
Figure 2.
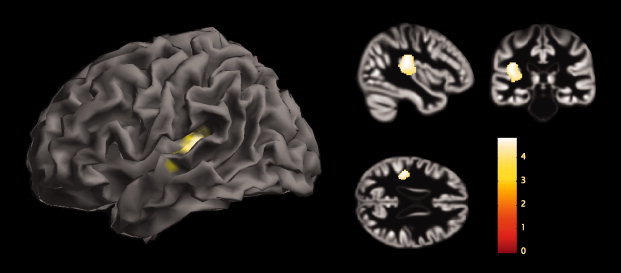
Group VBM differences. Results from the analysis of VBM8 showing gray matter volume reductions in PD patients compared with healthy elderly controls are displayed in the form of statistical maps superimposed on the surface of a standardized brain and on the sample's template created during Dartel normalization with peak intensity located at the global maxima.