
Figure 4.
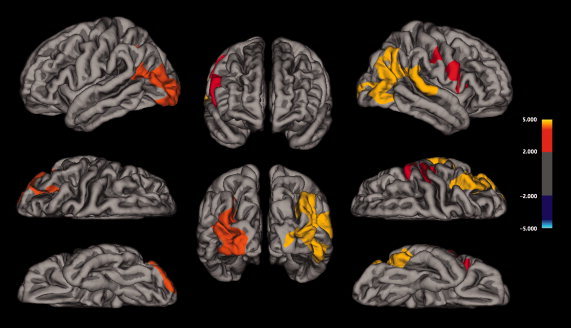
Group cortical thickness differences. Results from the analysis of cortical thickness showing cortical thinning in PD patients compared with healthy elderly controls are displayed at each vertex of the surface of a standardized brain (averaged over all subjects) in terms of t statistical maps.