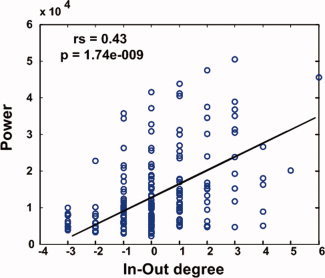
Figure 3.

Relation between BOLD signal power and In‐Out degree. For each of the seven nodes in the DMN, the low frequency BOLD power is plotted as a function of the In‐Out degree for all subjects (n = 27). The solid line represents the median regression fit. Spearman rank correlation coefficient (rs) and P value are indicated.
