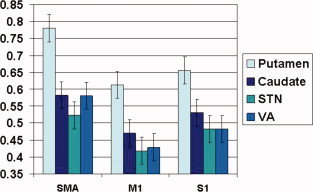
Figure 6.

Comparison of Functional connectivity of SMA versus M1 and S1 with subcortical structures of the cortico‐basal ganglia circuitry. Error bars represent +1 standard error of the mean. [Color figure can be viewed in the online issue, which is available at wileyonlinelibrary.com.]
