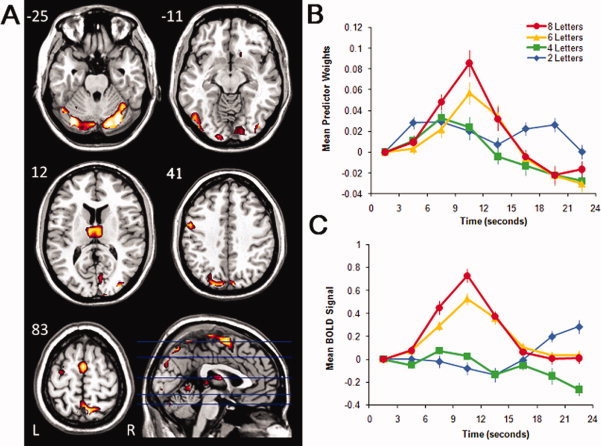
Figure 2.

Images, plots of predictor weights, and plots of BOLD signal for Component 2. The dominant 5% of component loadings are displayed (A), with positive component loadings displayed in red (min = 0.26) and yellow (max = 0.41). (No negative component loadings passed this threshold.) The mean FIR‐based predictor weights are plotted as a function of peristimulus time in the right panel, top (B; error bars are standard errors). The predictor weights at the first point of peristimulus time are adjusted to zero, and all other values scaled accordingly for each subject, and therefore differ from % signal change by a constant term only. The mean BOLD signal extracted from the regions displayed in (A) are plotted as a function of peristimulus time in the right panel, bottom (C; error bars are standard errors). Axial slices are located at the following Talairach z axis coordinates: −25, −11, 12, 41, 83. [Color figure can be viewed in the online issue, which is available at wileyonlinelibrary.com.]
