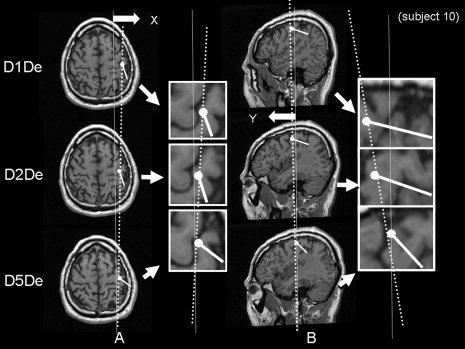
Figure 5.

Axial and sagittal sections of the brain showing representative data of ECD location and direction following D1De, D2De, and D5De stimuli in the right postcentral gyrus. Line A shows how the x‐axis decreases (lateral to medial) and line B shows how the y‐axis decreases (anterior to posterior) in the order of D1De, D2De, and D5De.
