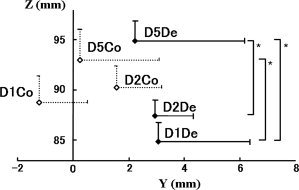
Figure 7.

Average localizations of ECD for each stimulation. The average of ECD locations was in the order of D5De, D2De, and D1De medially, posteriorly, and superiorly, respectively. Note the ECDs for D1De and D2De were located more deeply (z axis) than those for D5De stimuli (P = 0.003, P = 0.031). The distance between D1 and D5 was greater for decompression stimuli than for compression stimuli. Error bars represent standard errors for positive values.
