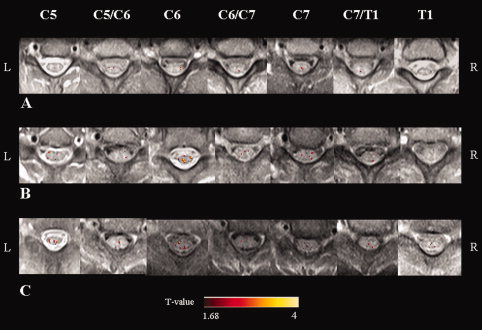
Figure 2.

Illustrative activation maps (color‐coded for t values) of cervical cord on axial proton‐density weighted spin‐echo images from C5 to T1, from a healthy volunteer (A), a patient with primary progressive (PP) multiple sclerosis (MS) (B), and a patient with secondary progressive (SP) MS (C) during a tactile stimulation of the palm of the right hand. R: right, L: left.
