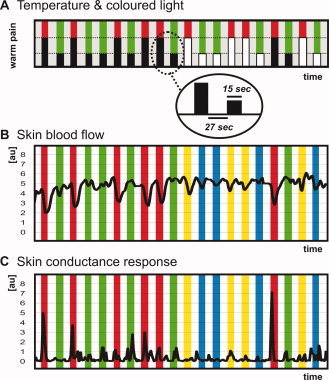
Figure 1.

Experimental procedure. A: Schematic diagram and time‐line of the applied stimuli. Visually displayed colored lights signaled the heat pain (red light) and the innocuous warmth (green light) stimuli. After conditioning, only the light was displayed, but no thermal stimulus was applied (indicated by white boxes). B: The mean SBF during the experiment is shown: heat pain experience (red bars), warmth experience (green bars), heat pain anticipation (yellow bars), and warmth anticipation (blue bars). C: The mean skin conduction response during the experiment is shown: heat pain experience (red bars), warmth experience (green bars), heat pain anticipation (yellow bars), and warmth anticipation (blue bars). [Color figure can be viewed in the online issue, which is available at wileyonlinelibrary.com.]
