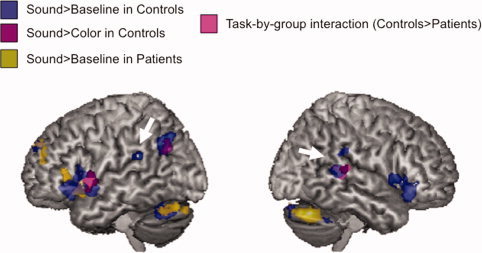
Figure 2.

Sound imagery in normal hearing and post‐lingually deaf subjects. Surface rendering for the main contrasts: in controls—sound more than baseline (blue blobs) and sound more than color (purple blobs); in CI candidates—sound more than baseline (yellow blobs); in task‐by‐group interaction—controls more than patients and sound imagery more than color (pink blobs). White arrows indicate our regions of interest. For better illustration purpose, an uncorrected p < 0.01 voxel level threshold was used, minimum voxel size 50. Reported blobs were significant at p < 0.05 FDR corrected.
