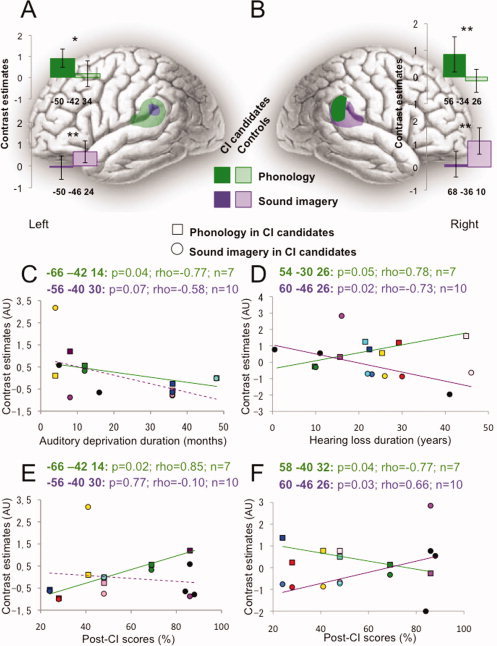
Figure 3.

Comparing residual processing of environmental sound and phonology in CI candidates, and as a function of deafness and post‐CI scores. A: Left and (B) right PSTG/SMG activation during the phonological (green blobs and histograms) and sound imagery (purple blobs and histograms) tasks, in CI candidates (dark colors) and controls (transparent colors). *p < 0.05; **p < 0.01. C–F: Each subject who participated in both tasks (n = 7) is individualized by a specific color. Squares are for the phonological task, circles for the sound imagery task. The three other subjects are black‐colored. C: Neural activity of the left PSTG/SMG decreased with auditory deprivation duration in both tasks in CI candidates. D: Neural activity of the right PSTG/SMG decreased with hearing loss duration in the sound imagery task but increased in the phonological task, in CI candidates. E: Neural activity of the left PSTG/SMG positively correlated with post‐CI scores in the phonological task. F: Neural activity of the right PSTG/SMG positively correlated with post‐CI scores in the sound imagery task but negatively in the phonological task.
