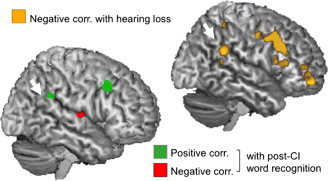
Figure 4.

Right hemisphere and surface rendering for whole brain correlation with hearing loss (negative correlation, yellow blobs) and with post‐CI scores at 6 month after surgery (positive correlation: green blobs. Negative correlation: red blobs). White arrows indicate our regions of interest. Effect displayed at p < 0.01 (T = 2.90), minimum voxel size 20.
