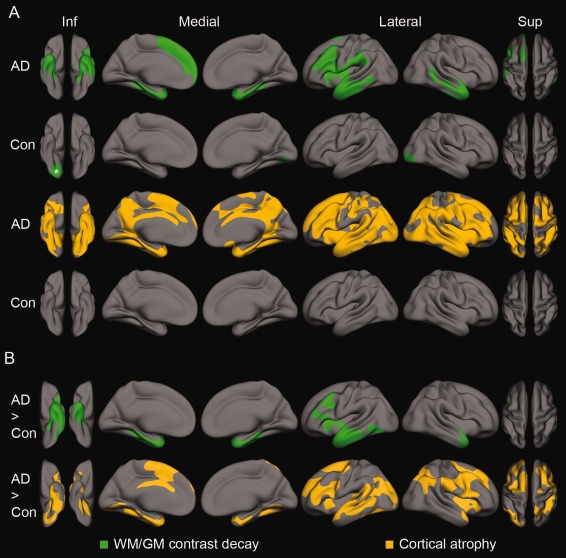
Figure 1.

Spatial clusters from surface‐based General Linear Models testing degree of annual change in WM/GM contrast and cortical thickness (A), and the effects of group (AD versus controls, B). A: WM/GM contrast (upper row, green) and cortical thickness (bottom row, orange) change for AD and controls, respectively. All clusters indicate a significant annual decay, except the WM/GM cluster in the controls marked with an asterisk, which showed an significant increase. B: WM/GM contrast (upper row, green) and cortical thickness (bottom row, orange). All clusters indicate areas of larger annual decay in AD than controls. Inf, inferior view; Sup, superior view; Con, controls. P < 0.05, corrected for multiple comparisons.
