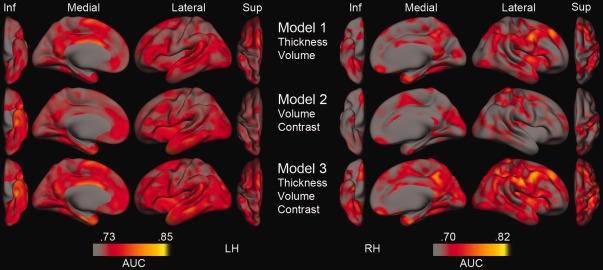
Figure 3.

Area under the curve (AUC) estimates at each vertex derived from vertex‐wise logistic regression. Inf, inferior view; Sup, superior view; Thickness, Cortical thickness change; Volume, Hippocampal volume change; Contrast, WM/GM contrast change; LH, left hemisphere; RH = right hemisphere. Please note that the current thresholding was set to highlight differences, thus possibly making relatively small differences seem more pronounced, and that no rigorous statistical testing of differences has been done.
