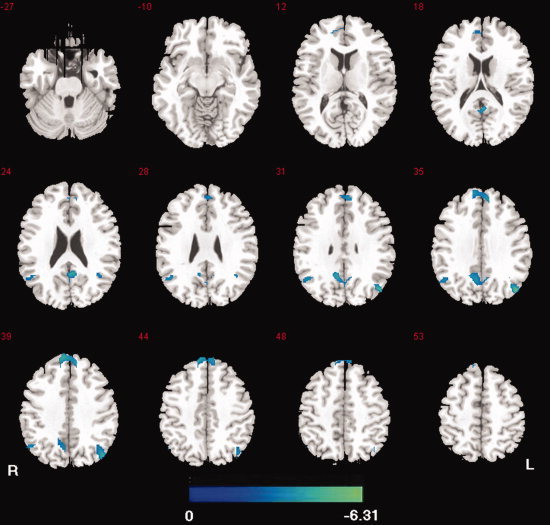
Figure 4.

Map of functional connectivity differences for PCC between the two groups. Compared with controls, no increased connection was found, and decreased connectivity was showed (cool) in absence epilepsy patients. The statistical threshold was P < 0.05 (FDR‐corrected, 20 adjacent voxels). [Color figure can be viewed in the online issue, which is available at wileyonlinelibrary.com.]
