
Figure 3.
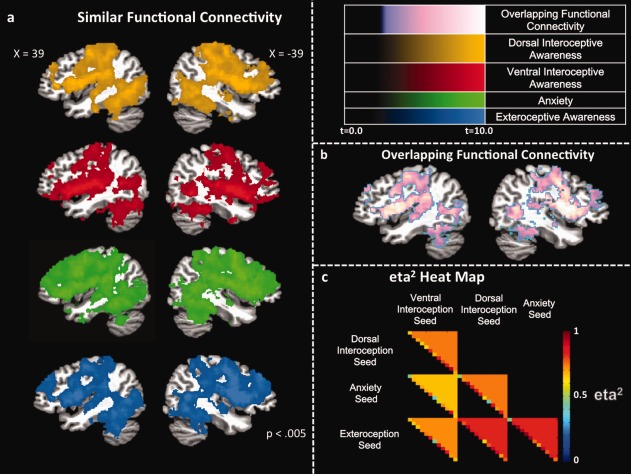
Random effects group conjunction analyses demonstrating regions of overlapping resting‐state functional connectivity to the interoception, exteroception, or anxiety insular seed regions. (a) Sagittal images show regions exhibiting resting‐state functional connectivity (P < 0.005) to the dorsal mid‐insula interoception seed region (gold), ventral mid‐insula interoception seed (red), ventral anterior insula anxiety seed (green), and dorsal anterior insula exteroception seed region. (b) Sagittal images showing regions of overlapping resting‐state functional connectivity (i.e., the conjunction of all four maps in Fig. 3a). The color intensity gradations in this figure represent the average t‐statistic at a voxel across all t‐maps included in the union of the t‐images. (c) eta2 heat map demonstrating high overall similarity in the whole‐brain resting‐state functional connectivity maps for the interoception, exteroception, or anxiety insular seed regions. The color of each triangle indicates the average eta2 value across all participants, with the individual participants' values indicated by the colors along the hypotenuse of each triangle.