
Figure 3.
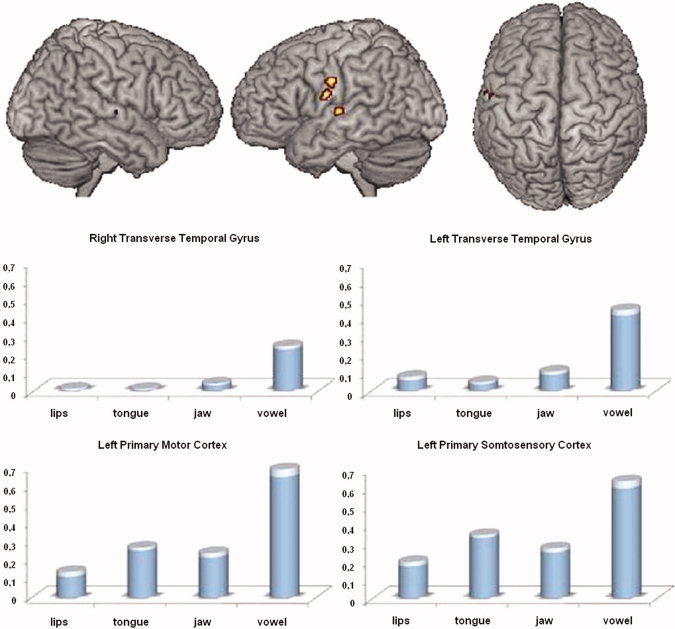
Main effect of motor task (random‐effect group analysis, F‐contrast, P < 0.05, FWE corrected, cluster extent threshold of 10 voxels, F > 17.71): brain regions showing activity differences between the four motor tasks (top) and contrast estimates reflecting percentage BOLD signal change from baseline for the observed activation peaks and the four motor tasks (bottom). Compared with the other tasks, stronger activations were observed in the left ventrolateral sensorimotor cortex and the bilateral primary auditory cortex for vowel vocalization. SEM are indicated in transparency. [Color figure can be viewed in the online issue, which is available at wileyonlinelibrary.com.]