
Figure 3.
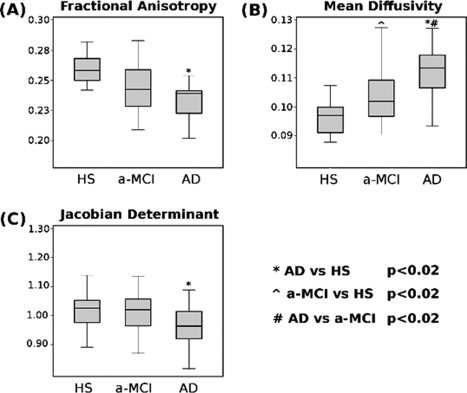
Box‐plots showing mean and percentile distributions of the fractional anisotropy (FA), mean diffusivity (MD), and Jacobian determinants (JD) values in the cingulate bundles of patients with Alzheimer's disease (AD) and amnestic mild cognitive impairment (a‐MCI), and healthy controls. The boundaries of the boxes represent the 25th and the 75th percentiles; the upper and lower bars represent the smallest and largest observations. FA values were significantly lower in AD patients as compared to HS. MD values were significantly different across all groups, with a progressive increasing from HS to a‐MCI, to AD patients. JD were significantly lower in AD patients as compared to HS, in the absence of other group differences (see text for further details).