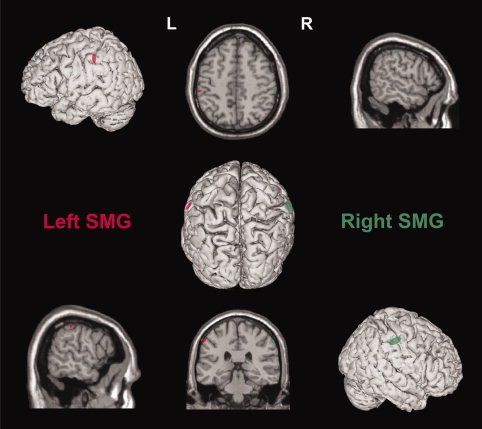
Figure 2.

Coregistration of the stimulation sites over the right (green) and left (red) SMG. Each ellipse is centred on the mean MNI coordinates (x, y, z, mean ± SD; n = 16) of the stimulation sites in the right (60 ± 4, −28 ± 7, and 47 ± 6 mm) and left (−59 ± 3, −32 ± 11, and 46 ± 6 mm) hemisphere. The ellipse surface shows the 95% confidence interval of the normalized coordinates calculated for each subject.
