
Figure 3.
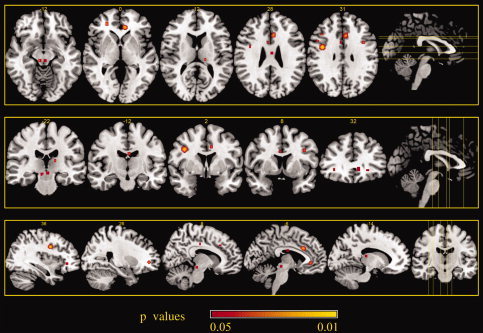
Areas of increased activity associated with placebo analgesia in the expectation stage 1. ALE maps were computed using GingerALE 2.0.4 at an FDR‐corrected threshold of P < 0.05, with a minimum cluster size of K > 50 mm3 and visualized using MRIcron.