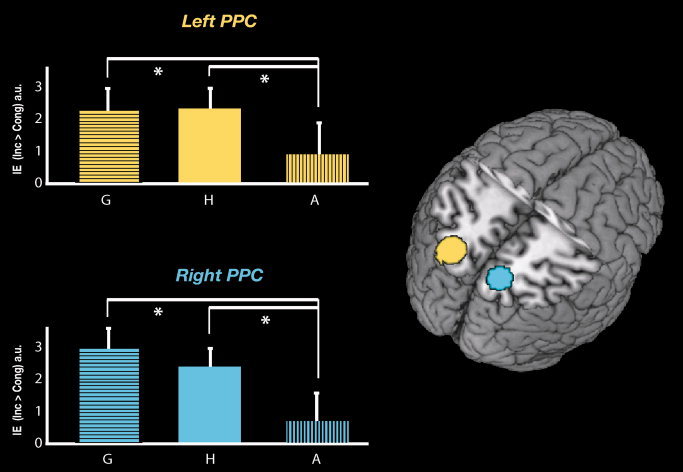
Figure 4.

Activity in the bilateral PPC regions elicited by the IE of the two biological distracters respect to non‐biological distracter. Right panel: 3D rendering of the canonical MNI template showing the localization of two ROI corresponding to the left (yellow) and right (light blue) PPC is reported in the axial section. Left panel: the relative plots show the mean IE [IE (inc < cong)] of the three distracters (averaged across the two effector, respectively). A significant interaction was observed in these ROIs: biological distracter (G = Gaze/H = Hand) interfered on shifts of attention more than the non‐biological (A = Arrow) distracter. The asterisks indicate significant higher IE for (G than A), and higher IE for (H than A) in both regions. The level of activation is expressed in arbitrary units (a.u., ±90% confidence interval).
