
Figure 5.
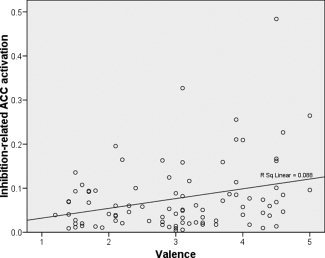
Scatter plots of valence (1, negative, to 5, positive) and inhibition‐related ACC activation (centroid coordinates of the ROI: 5 25 20) showing the regression line. Number of cases: 90 [30 participants × 3 conditions (NogoA−, NogoN, NogoA+)].