
Figure 2.
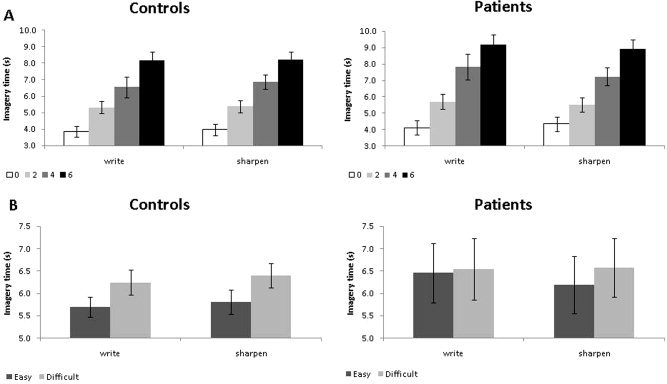
Behavioural performance during scanning. This figure illustrates the imagery times (IT) measured in trials involving (A) different movement repetitions (0, 2, 4, and 6) and (B) different biomechanical constraints (easy, difficult) separately for each task (write, sharpen) and group (controls, patients).