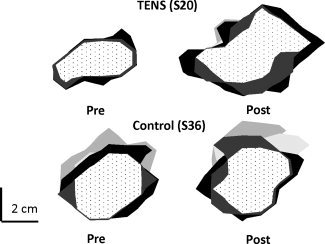
Figure 4.

Representative map areas of the ABP (light‐gray), ADM (intermediate gray), FCR (dark gray) and ECR (black) and their overlaps (dotted area) before (Pre—left hand column) and after 3 weeks (Post—right hand column) of sensory intervention with TENS versus control.
