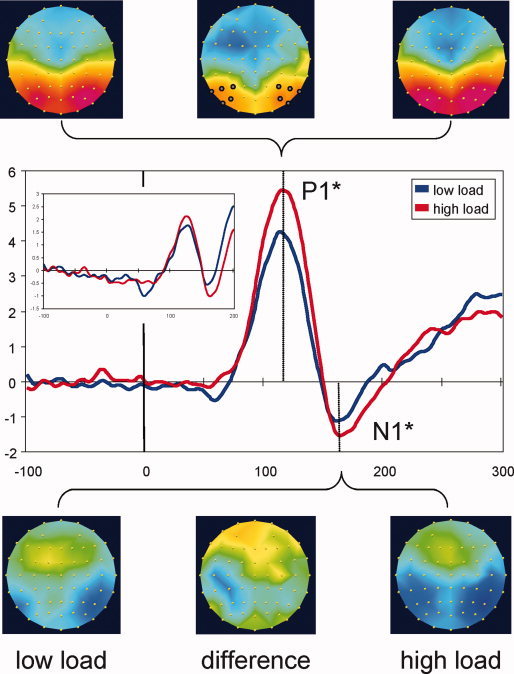
Figure 2.

Task‐only VEPs. Waveforms show VEPs elicited by nonimperative central task stimuli in the absence of peripheral probes and represent grand averages across 10 lateral posterior electrodes highlighted on the top‐central map. Topographic maps are shown for the P1 (115 ms) and N1 (165 ms) peak latencies, for low‐load and high‐load conditions (scaled to ±5 μV) as well as their difference (high load minus low load, scaled to ±2.5 μV). N1 differences were significant when measured peak‐to‐peak (N1 minus P1). The inset shows the average across six central posterior electrodes used for C1 analyses (see below) and indicates that a C1 component was absent following foveal stimulation. *P < 0.05. [Color figure can be viewed in the online issue, which is available at wileyonlinelibrary.com.]
