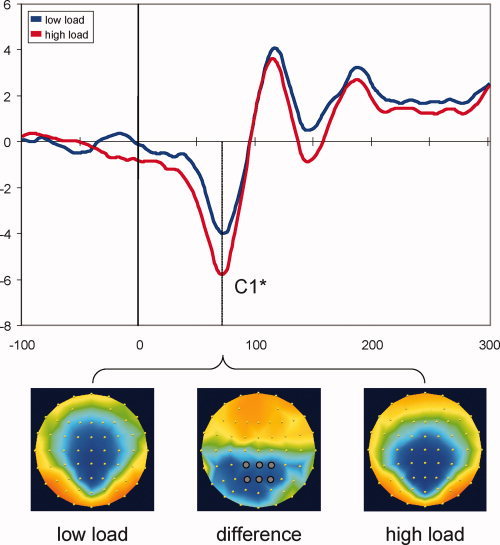
Figure 3.

Task‐plus‐probe VEPs. Waveforms show VEPs elicited by non‐imperative task stimuli accompanied by peripheral probes, averaged across six central posterior electrodes highlighted on the central map. C1 activity is largely determined by the peripheral stimulation (compare with Fig. 2). C1 peak amplitudes differed significantly between load conditions, with higher probe‐related activity in the high‐load condition. Topographic maps are shown for the C1 peak latency (75 ms), separately for low‐ and high‐load conditions (scaled to ±5 μV), as well as their difference (high load minus low load, scaled to ±2.5 μV). *P < 0.05. [Color figure can be viewed in the online issue, which is available at wileyonlinelibrary.com.]
