
Figure 4.
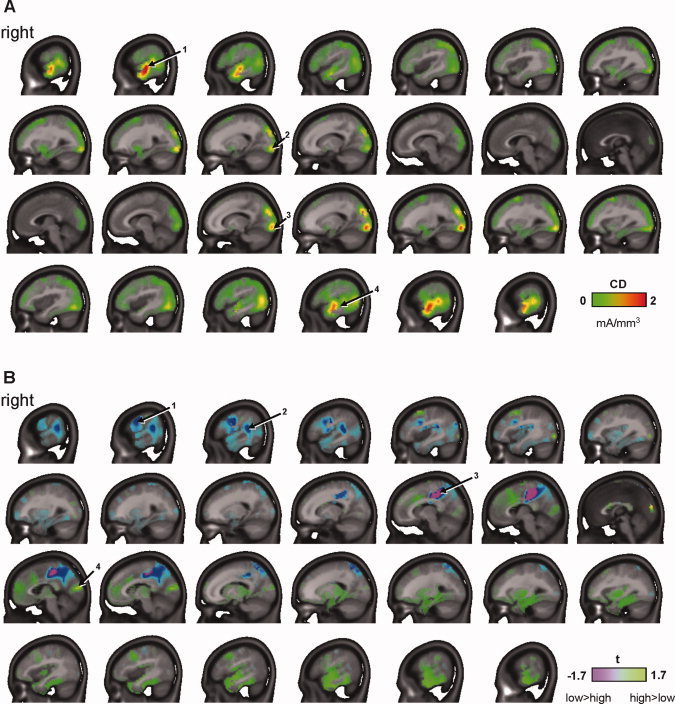
Results of distributed inverse solutions using LAURA. Sagittal slices are shown from right (top) to left (bottom). A: Inverse solutions over the C1 interval (45–70 ms), averaged across subjects and load conditions. Principal activation foci were located bilaterally in lower visual cortex (2, 3) and middle temporal cortex (1, 4). Data shown are current densities (CDs) in mA/mm3. B: Inverse solutions were compared between load conditions for each subject using paired point‐by‐point t‐tests (high minus low load) and subsequently averaged over the C1 interval and across subjects. Maps of t‐values shown are scaled to P = 0.10 for df = 13. Results indicated higher activity under low load in regions including right FEF (1), right TPJ (2), and bilateral PCC (3). In accordance with VEP results, a marginally significant increase in activity under high load was observed in the cuneus bilaterally (4). [Color figure can be viewed in the online issue, which is available at wileyonlinelibrary.com.]