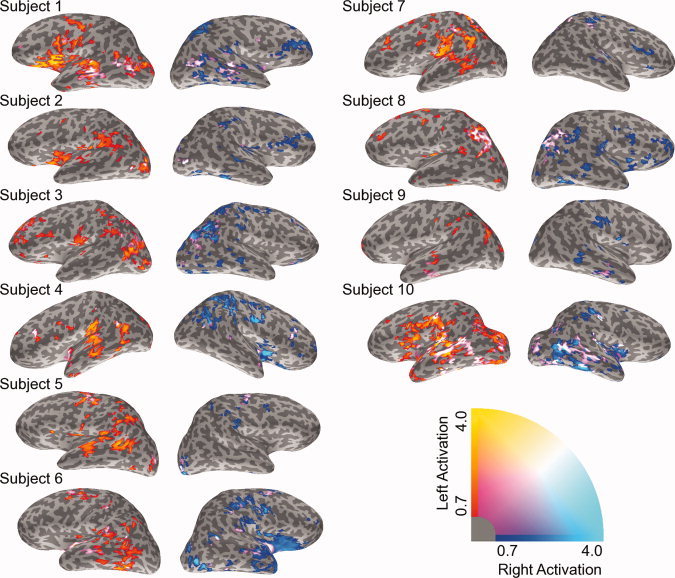
Figure 2.

Language‐related laterality maps are shown for all healthy control subjects. All subjects were right handed. Left and bilateral activation are shown on the left hemisphere. Right and bilateral activation are shown on the right hemisphere. Left lateralized activation is depicted as red‐to‐yellow and right lateralized activation is depicted as blue‐to‐cyan. Bilateral activation is shown as the combination of both color scales (purple). Significant activation only is shown (P < 0.01).
