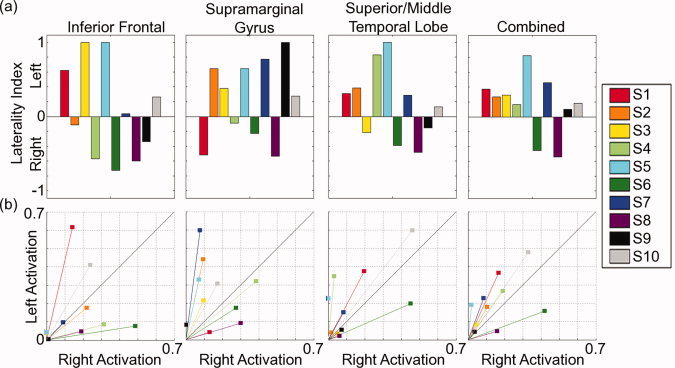
Figure 3.

Laterality scores for each ROI and for all healthy control subjects are shown as (a) laterality indices (LIs) and (b) complex laterality vectors (CLVs). LIs are plotted as bars between −1 and 1, indicating right‐to‐left hemisphere dominance. CLVs are plotted as 2D vectors, where angle indicates laterality and length indicates activation magnitude.
