
Figure 2.
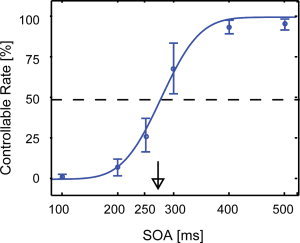
The relationship between SOA and controllable rate. Controllable rate as a function of SOA averaged across all observers in Experiment A. We fitted an accumulative density function for Gauss distribution to the average controllable rates of six SOA levels using the least‐squares method. The thick arrow indicates the threshold SOA. The error bar indicates the standard deviation (SD) for the 10 observers. The threshold SOA was 274 ms (SD: 32 ms) for all observers.