
Figure 3.
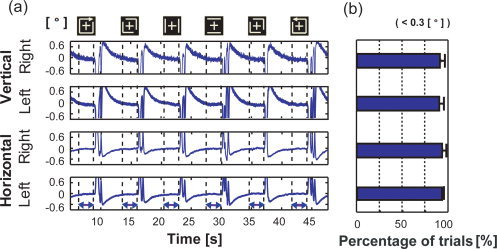
EOG signal when performing intentional control in Experiment B. (a) Typical time series of EOG. The upper two time series indicate the vertical movement of the right and left eyes, and the lower two courses indicate their horizontal movement. The x‐axis indicates time and the y‐axis indicates the visual angle [labeled on the left side of (a)], which was estimated from voltage [labeled on the right side of (a)] and measured by our EOG system (see “Eye Movement Recording” section). The horizontal double‐ended arrows denote the main periods of six trials. Cue stimuli for respective trials are drawn at the top of the time courses. (b) The percentage of trials in which the visual angle was estimated from the maximum potential difference between the paired sensors in the main periods was smaller than 0.3°. The amplitude of 0.3° is much smaller than the size of the fixation cross (3.0°). This result is the average for the 10 observers, and error bars indicate the standard deviations of their samples.