
Figure 7.
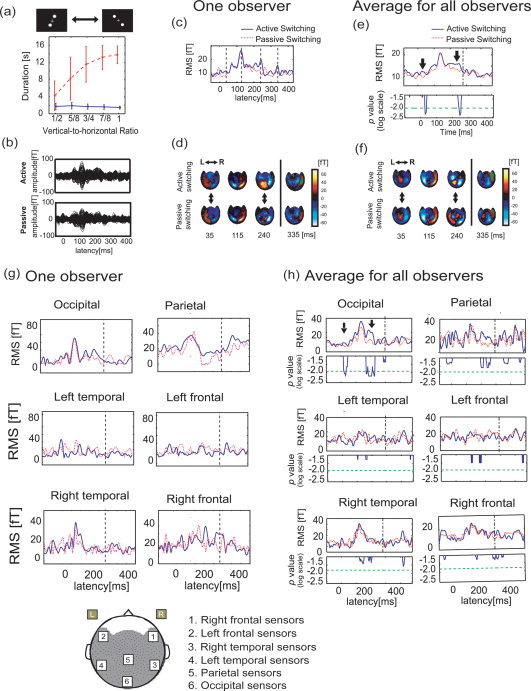
Comparison of MEG activity evoked by active and passive switching in Experiment E. (a) Relationship between the vertical‐to‐horizontal ratio of the stimulus size and the duration time of the perception of the initial vertical motion for one observer (solid blue line: average duration time for active switching ensemble; dotted red line: average duration time for passive switching ensemble). Here, the error bar indicates the standard deviation for each vertical‐to‐horizontal ratio. (b) A pair of the MEG waveforms with all 440 SQUID sensors for one observer when the observer actively switched the perceived motion and when the perceived switching occurred passively. (c) The RMS values of all sensors for the active and passive switches (solid blue line: the active switch; dotted red line: the passive switch). (d) The MF maps at four latencies, which are expressed as dotted lines in (c). Two double‐ended arrows express the latencies when a significant difference in RMS values was commonly observed for all observers. The upside and downside of this map correspond to the frontal region and the occipital region, respectively. (e) Average RMS values after stimulus onset for all observers (solid blue line: average RMS values for active switching ensemble; dotted red line: average RMS values for passive switching ensemble), and results of the two‐tailed Wilcoxon Signed rank test between the two ensembles [solid blue line: time course of P‐value; dashed‐dotted green line: significance level (P < 0.01)]. In the figure of the average RMS value, the dashed‐dotted line indicates 275 ms. Two thick arrows indicate the latencies at which a significant difference was observed between the two ensembles. (f) The MF maps at four latencies which are expressed dotted lines in (e). The figures in (g) are the RMS values of one observer for the 10 sensors of local regions. The figures in (h) are ones of the average for all observers. The spatial map is shown below the figures of (g).