
Figure 8.
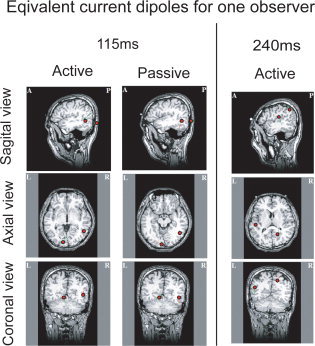
Equivalent current sources estimated for one observer. The latencies were selected when a significant peak was observed. At 115 ms (the early component), we observed a typical peak for active and passive conditions. The two ECDs were estimated near right MT+ region and near left V1/V2 region. Furthermore, the two ECDs at 240 ms was estimated in the vicinity of the right parietal region and left temporal region.