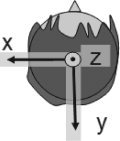
Table I.
Dipole locations for individual observers: The results of ECDs for the succeeded case for individual observes 
| Latency (ms) | GOF (%) | Dipole (No.) | x (mm) | y (mm) | z (mm) | Intensity (nA m) | |
|---|---|---|---|---|---|---|---|
| Succeeded case: Early component (100–150 ms) | |||||||
| Subject 1 | 115 | 89.8 | 1 | −46.9 | 37.3 | 44.7 | 3.0 |
| 2 | 10.2 | 68.9 | 32.1 | 10.7 | |||
| Subject 2 | 130 | 87.8 | 1 | −41.5 | 55.3 | 41.8 | 13.1 |
| 2 | 5.1 | 29.8 | 55.8 | 22.7 | |||
| Subject 3 | 132 | 86.3 | 1 | −48.3 | 48.2 | 38.3 | 16.1 |
| 2 | −16.1 | 23.8 | 55.9 | 21.5 | |||
| Subject 4 | 134 | 87.6 | 1 | −28.5 | 59.2 | 32.4 | 2.1 |
| 2 | 44.3 | 73.4 | 11.6 | 7.7 | |||
| Subject 5 | 126 | 85.6 | 1 | −34.3 | 49.2 | 35.0 | 6.1 |
| 2 | 20.9 | 82.1 | 40.0 | 4.1 | |||
| Subject 6 | 136 | 89.4 | 1 | −42.0 | 62.3 | 36.5 | 8.5 |
| 2 | 36.2 | 27.1 | 65.5 | 6.4 | |||
| M300 | |||||||
| Subject 1 | 300 | 89.2 | 1 | 24.6 | 6.8 | 21.3 | 12.4 |
| 2 | −46.8 | −13.1 | 58.6 | 6.4 | |||
| Subject 2 | 298 | 89.5 | 1 | 43.7 | 21.6 | 19.5 | 12.7 |
| 2 | −52.6 | −17.5 | 48.2 | 9.6 | |||
| Subject 3 | 296 | 86.4 | 1 | −0.5 | −38.7 | 26.8 | 7.5 |
| 2 | 75.7 | 32.5 | 30.7 | 3.3 | |||
| Subject 4 | 312 | 89.6 | 1 | 7.4 | 41.4 | 13.6 | 6.8 |
| 2 | −39.3 | −18.2 | 57.1 | 3.7 | |||
| Subject 5 | 308 | 89.4 | 1 | 27.6 | 42.8 | 48.3 | 7.8 |
| 2 | −34.0 | −26.3 | 40.8 | 5.6 | |||
The observers with GOFs greater than 85% were selected. The results of failed case are not shown because the early component in the case was similar to the result of succeeded cases and there were no typical peaks for p300 in the condition. The 3/6 observers showed the activity around the right MT + region (subjects 1, 2, and 4) and one of dipoles around 300 ms for 3/5 selected observes showed activation in frontal cortex (the second dipole of subjects 1, 2, and 4).
