
Figure 1.
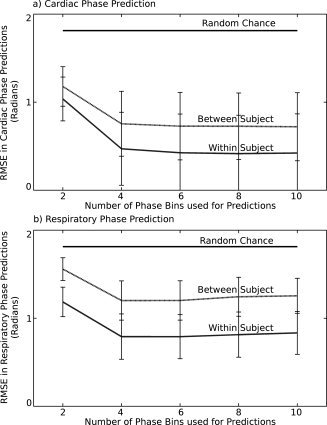
Graphs of root mean squared error (RMSE) in predictions of (a) cardiac and (b) respiratory phase. In each graph, black line displays results from the benchmark predictions using random number generation, the dashed gray line displays results from between‐subject training (median values), and the solid gray line (lowest values) displays results from within‐subject training. In each case, error bars are ± one standard deviation (error bars on random number generation results too small to plot).