
Figure 3.
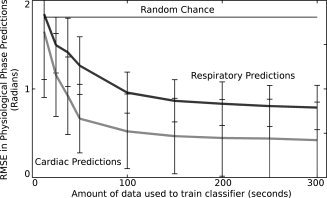
Graph of root mean squared error (RMSE) in predictions of cardiac (light gray) and respiratory (dark gray) phase from fMRI data as amount of training data is reduced. Also displayed is a line (black) indicating the RMSE error resulting from random chance predictions of physiological phase. Means and errors (±one standard deviation) are taken over all subjects. In each case, data was removed from the start of the training set until the desired amount was left. A model was then trained on this data, and used to predict physiological phase for the entirety of the second half of the dataset. The model used in this case takes a value of N = 6.