
Figure 4.
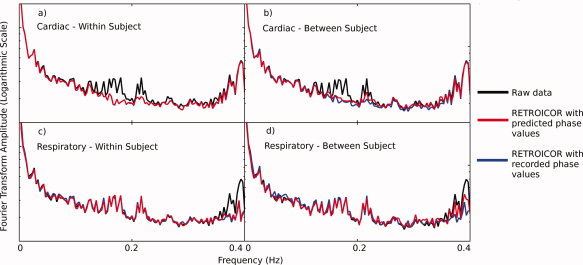
Example Fourier Transforms of dataset with median RMSE in predictions. In each plot, the black line displays the raw (no RETROICOR) data, blue line displays data after RETROICOR has been applied using recorded physiological phase values and red line displays data after RETROICOR has been applied using predicted physiological phase values. The plots show (a) detrending of the cardiac cycle using predicted values created by training within the subject's data, (b) detrending of cardiac cycle using predicted values from training between subjects, (c) detrending of respiratory cycle using predicted values created by training within the subject's data, and (d) detrending of respiratory cycle using predicted values from training between subjects. Each was calculated based on the last 240 time points in each dataset. Fourier transforms of the physiological monitoring data showed that the cardiac cycle has a fundamental frequency that varied in the approximate range 0.95–1.5 Hz (aliased to 0.15–2.5 Hz in the fMRI data), whilst the respiratory cycle had a fundamental frequency between 0.35 and 0.42 Hz. [Color figure can be viewed in the online issue, which is available at wileyonline library.com.].