
Figure 5.
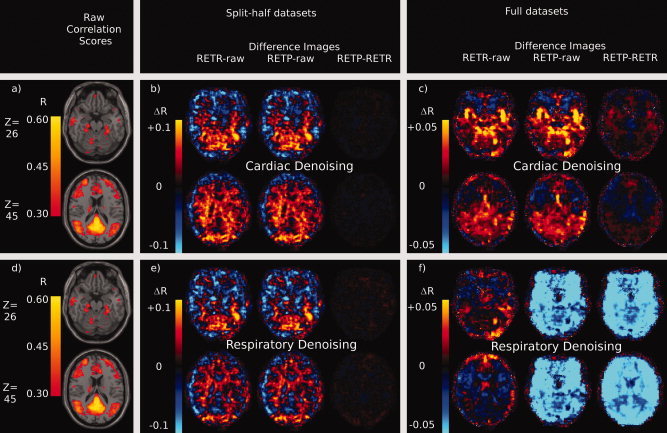
Effects of RETROICOR using recorded or predicted physiological phase values on voxelwise Pearson correlation scores with a seed timecourse in the PCC. Raw correlation scores are thresholded at 0.3 (uncorrected) and displayed (a, d) overlaid on an MNI structural atlas. Figures a and d are identical and are repeated for reference. RETROICOR was then used to remove the effects of the cardiac cycle (b, c) or the respiratory cycle (e, f) and correlation scores were recalculated. Difference images were calculated by comparing the average correlation score in each voxel from two of the following three preprocessing steps: RETROICOR with recorded phase values (RETR), RETROICOR with predicted phase values (RETP) or no physiological noise removal (raw). For each figure the leftmost image is of the RETR‐raw difference image, then the RETP‐raw image, with RETP‐RETR rightmost. The case where only half the data set was used (within subject training for prediction) is demonstrated for cardiac cycle (b) and respiratory cycle (e) noise removal. The case where all data was used (between subject training for prediction) is displayed for the cardiac cycle (c) and respiratory cycle (f) also. [Color figure can be viewed in the online issue, which is available at wileyonlinelibrary.com.].