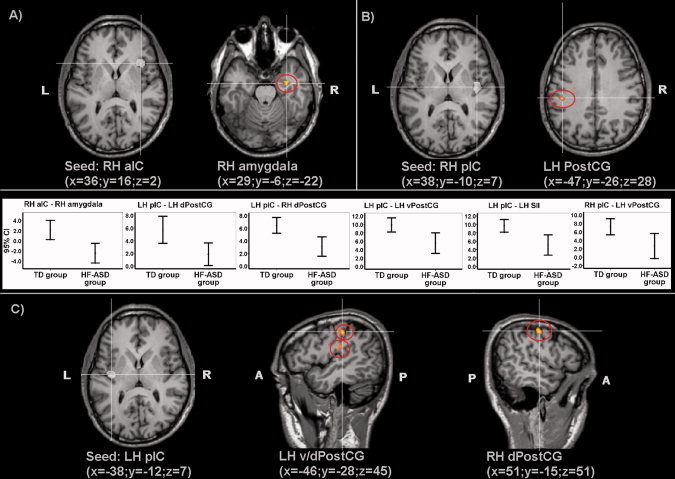
Figure 1.

Group statistical maps showing brain regions with significant differences (random effect analysis, P < 0.05 FDR corrected) between connectivity maps of the TD and HF‐ASD group based on: (A) seed ROI “right anterior insular cortex” (RH aIC) (x = 36, y = 16, z = 2); (B) seed ROI “right posterior insular cortex” (RH pIC) (x = 38, y = −10, z = 7); (C) seed ROI “left posterior insular cortex” (LH pIC) (x = −38, y = −12, z = 7); corresponding graphics showing 95% confidence intervals (CI) of functional connectivity in the TD and HF‐ASD group.
