
Figure 3.
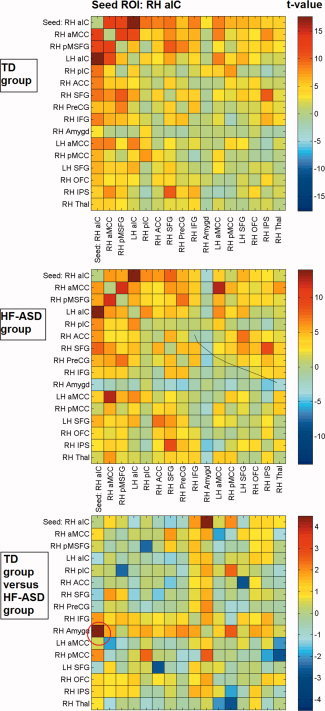
Cross‐correlation matrices showing color‐coded t‐values of connectivity between brain regions within the RH aIC network for the typically developing (TD) and high‐functioning autism spectrum disorder (HF‐ASD) group, based on the peak coordinates and 6 mm radius of the main network nodes.