
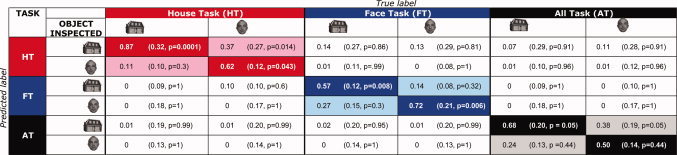
Table II.
Classification scores for longest fixations during a TR [Color table can be viewed in the online issue, which is available at wileyonlinelibrary.com.]
|
Correct scores are displayed on the diagonal. Chance levels are based on 1000 permutations (displayed between brackets). P‐values represent the fraction of permuted classifications that score higher than the correctly labeled dataset.