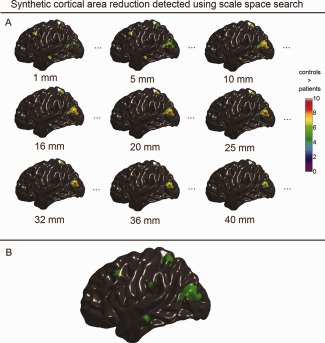
Figure 9.

Synthetic population differences in cortical surface area detected with scale space search. A: Unified P‐value thresholded t maps of selected scales that were equal or close to the filters used in the single‐filter analyses (full results are available in Movie 3 included in the Supporting Information). B: Spatial locations of the detected surface area changes integrated over the scale dimension. [Color figure can be viewed in the online issue, which is available at http://wileyonlinelibrary.com.]
