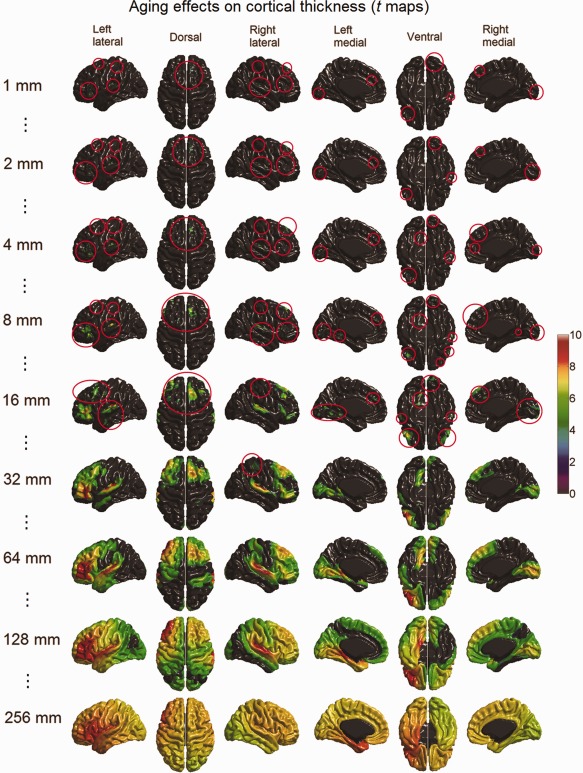
Figure 13.

Age‐related cortical thickness reduction detected with scale space search (t maps thresholded with unified P‐value, tα = 0.05 = 4.8) at selected scales (full results are available in Movie 5 included in the Supporting Information). At fine scales, aging effects on cortical thickness showed in small regions, which are rather difficult to see in the small visualizations here. The spatial locations of these foci are highlighted with red circles. With the increase of the scale, most these foci extended and merged into large regions. [Color figure can be viewed in the online issue, which is available at http://wileyonlinelibrary.com.]
