
Figure 1.
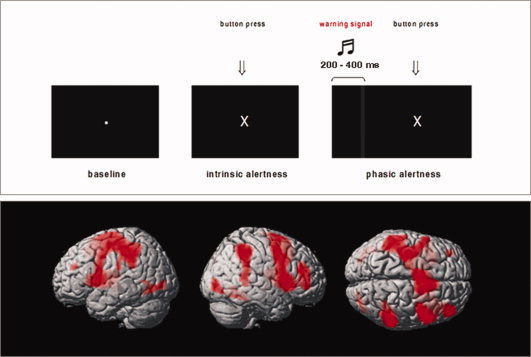
Top: Activation task for fMRI. Bottom: Brain activation during intrinsic and phasic alertness. Shown are rendered images (left, right, and superior views) derived from a GLM second‐level t‐test model using a conjunction analysis for the IA (controls and preHD) and the PA (controls and preHD) condition; P < 0.001, uncorrected at the voxel‐level, P < 0.05 corrected for spatial extent. The second‐level maps are rendered on the anatomical template implemented in SPM5. [Color figure can be viewed in the online issue, which is available at wileyonlinelibrary.com.]