
Figure 3.
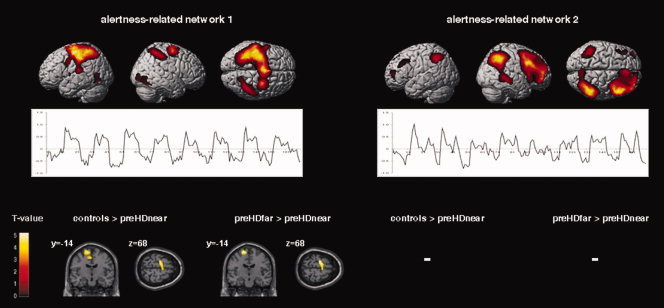
Top: ICA‐derived spatial patterns and related time‐course means of those networks of interest, which showed a positive temporal correlation with the IA and PA regressors (left, right, and superior view). Results from the second‐level within‐group t‐tests including controls and preHD individuals (P < 0.001, uncorrected at the voxel‐level, P < 0.05 corrected for spatial extent). Bottom: Areas with decreased functional connectivity in preHDnear participants compared with healthy participants and preHD far from the estimated motor symptom onset. Results from the second‐level between‐group ANOVA (P < 0.001, uncorrected at the voxel‐level, P < 0.05 corrected for spatial extent); see Table IV for detailed coordinates and Z‐scores. The second‐level maps are rendered on the anatomical templates implemented in SPM5. [Color figure can be viewed in the online issue, which is available at wileyonlinelibrary.com.]