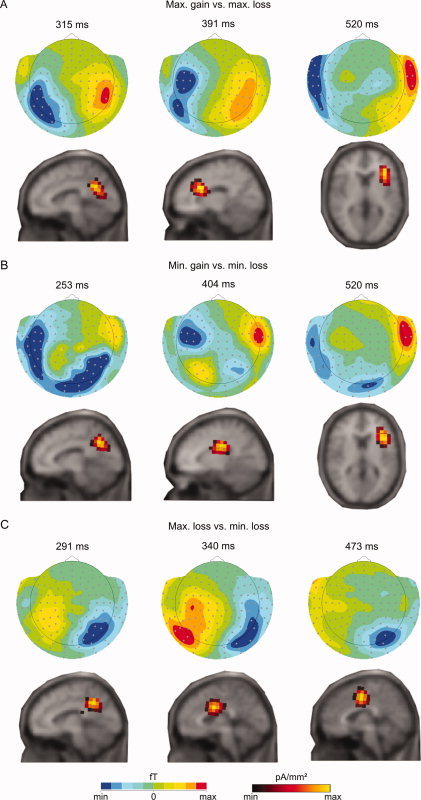
Figure 2.

Difference evoked response plots and source density estimates of the difference between (A) maximum gain and maximum loss at 315 ms (−70–70 fT; 3.65–4.25 pA/mm2), 391 ms (−60–60 fT; 3.28–3.96 pA/mm2), and 520 ms (−50–50 fT; 3.95–4.70 pA/mm2); between (B) minimum gain and minimum loss at 253 ms (−30–30 fT; 2.12–2.65 pA/mm2), 404 ms (−45–45 fT; 4.59–5.40 pA/mm2), and 520 ms (−55–55 fT; 3.25–3.77 pA/mm2); and between (C) maximum and minimum loss at 291 ms (−45–45 fT; 2.05–2.38 pA/mm2), 340 ms (−40–40 fT; 2.24–2.80 pA/mm2), and 473 ms(−50–50 fT; 1.11–1.39 pA/mm2). [Color figure can be viewed in the online issue, which is available at wileyonlinelibrary.com.]
