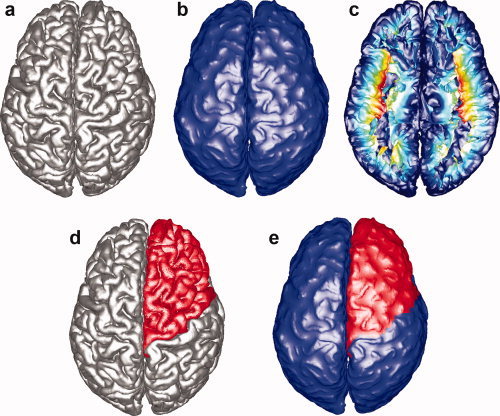
Figure 1.

Flow chart of the main steps of the proposed GI computation algorithm. Each figure explains the major steps of the algorithm: (a) Triangular mesh of the pial surface. (b) Outer hull surface computation. (c) Geodesic depth computation: the color‐coding corresponds to the computed geodesic depth where shallow regions are colored in blue and deep regions are colored in red. (d) Region of interest on the pial surface selection: frontal lobe is selected (colored in red) in this demonstration. (e) Corresponding region on the outer hull surface computation: the corresponding region is computed (colored in red). [Color figure can be viewed in the online issue, which is available at wileyonlinelibrary.com.]
