
Figure 2.
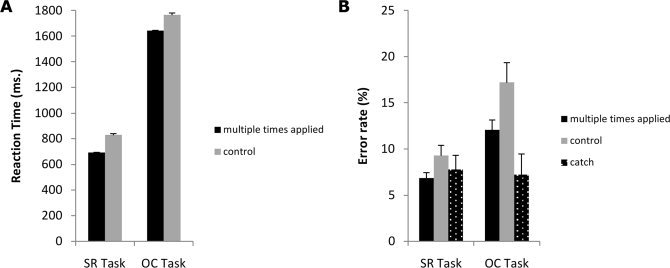
Panel A, Reaction times for both the SR task (left bars) and OC task (right bars) in the training session for the multiple times applied (black bar) and control trials (grey bar). Panel B, error rates for both the SR task (left bars) and OC task (right bars) in the training session for the multiple times applied (black bar), control (grey bar) and catch trials (white dotted black bar).