
Figure 3.
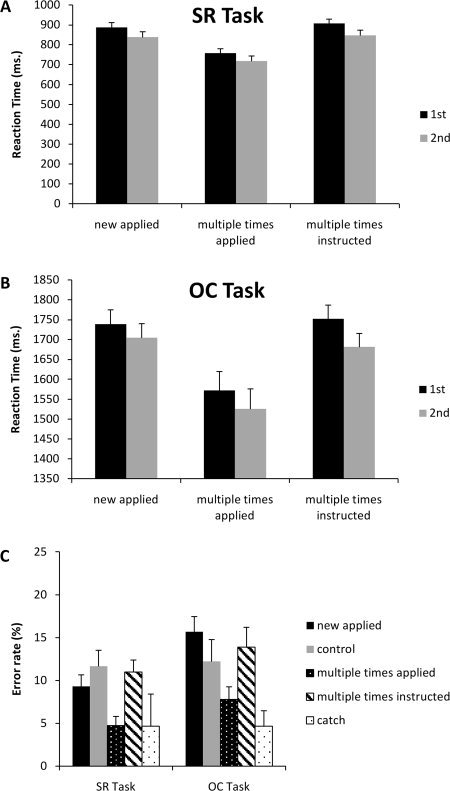
Panel A, Reaction times for the SR task for the new applied, multiple times applied and multiple times instructed trials. Black bars represent 1st time presentation, grey bars 2nd time presentation. Panel B, Reaction times for the OC task for the new applied, multiple times applied and multiple times instructed trials. Black bars represent 1st time presentation, grey bars 2nd time presentation. Panel C, error rates for both the SR task (left bars) and OC task (right bars) in the test session for the new applied (black bar), control (grey bar), multiple times applied (white dotted black bar), multiple times instructed (black stripped white bar) and the catch trials (black dotted white bar).