
Figure 5.
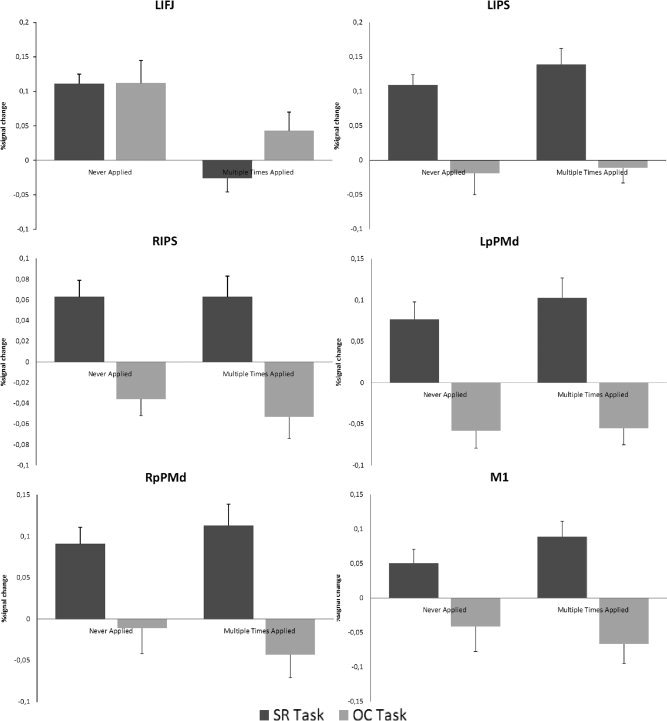
Percent signal change analysis for left IFJ (LIFJ), left IPS (LIPS), right IPS (RIPS), left pre‐PMd (LpPMd), right pre‐PMd (RpPMd), and M1. From left to right the bars represent: the never applied trials in the SR task (dark grey), the never applied trials in the O–C task (light gray), the multiple times applied trials in the SR task (dark grey), and the multiple times applied trials in the O–C task (light gray).